[멋사 AI 7기] 파이썬 데이터 분석 기초
![]() 기본 EDA(Exploratory Data Analysis)와 기술통계
기본 EDA(Exploratory Data Analysis)와 기술통계
기술통계 추상화된 도구
- Pandas Profiling
- SweetViz
- AutoViz - bokeh
위와 같은 도구들을 사용할 때 간편한 명령으로 탐색적 데이터 분석을 할 수 있음
하지만, 리포트 출력이 오래걸리는 등 대용량 데이터에 사용하기 어려운 단점이 있다.
Seaborn
Plot 종류
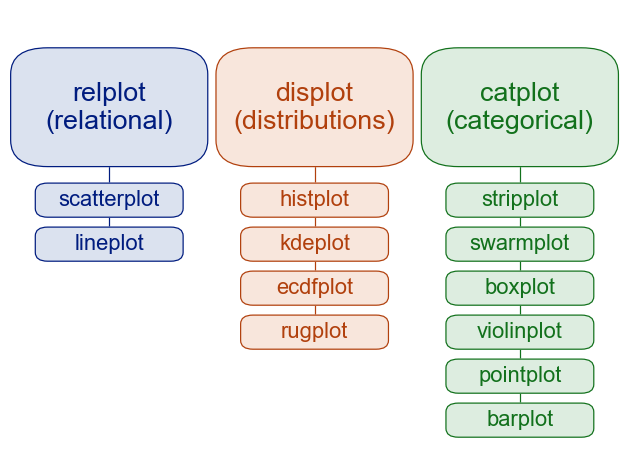
(Overview of seaborn plotting functions organization)
- heatmap(df, cmap, annot, mask)
- lmplot / regplot
- residplot
- joinplot
- pairplot
- boxenplot : boxplot보다 수염이 더 잘나타남 < violinplot
Parameter : 문서 참조
- bins : the number of bins
- kde(Kernel Density Estimation) : smooths the observations with a Gaussian kernel, producing a continuous density estimate
- hue : draw a separate histogram for each of its unique values and distinguish them by color
- col : draw each individual distribution in a separate subplot
- kind
- ci => errorbar
- estimator
- col_wrap : wrap the column variable at this width, so that the column facets span multiple rows. Incompatible with a row facet.
기타
load_dataset - use get_dataset_names() to see a list of available datasets
seaborn 그래프 크기 고정
- sns.set(rc={‘figure.figsize’:(x, y)})
matplotlib.pyplot
- colormaps
- figure(figsize=(x, y))
- show : 로그 출력x 다른 방법으로는 ~.plt(~)후에 ;를 찍어도 됨
통계
왜도와 첨도
- 비대칭도(왜도) : 확률 변수의 확률 분포 비대칭성을 나타내는 지표

(출처 위키백과)
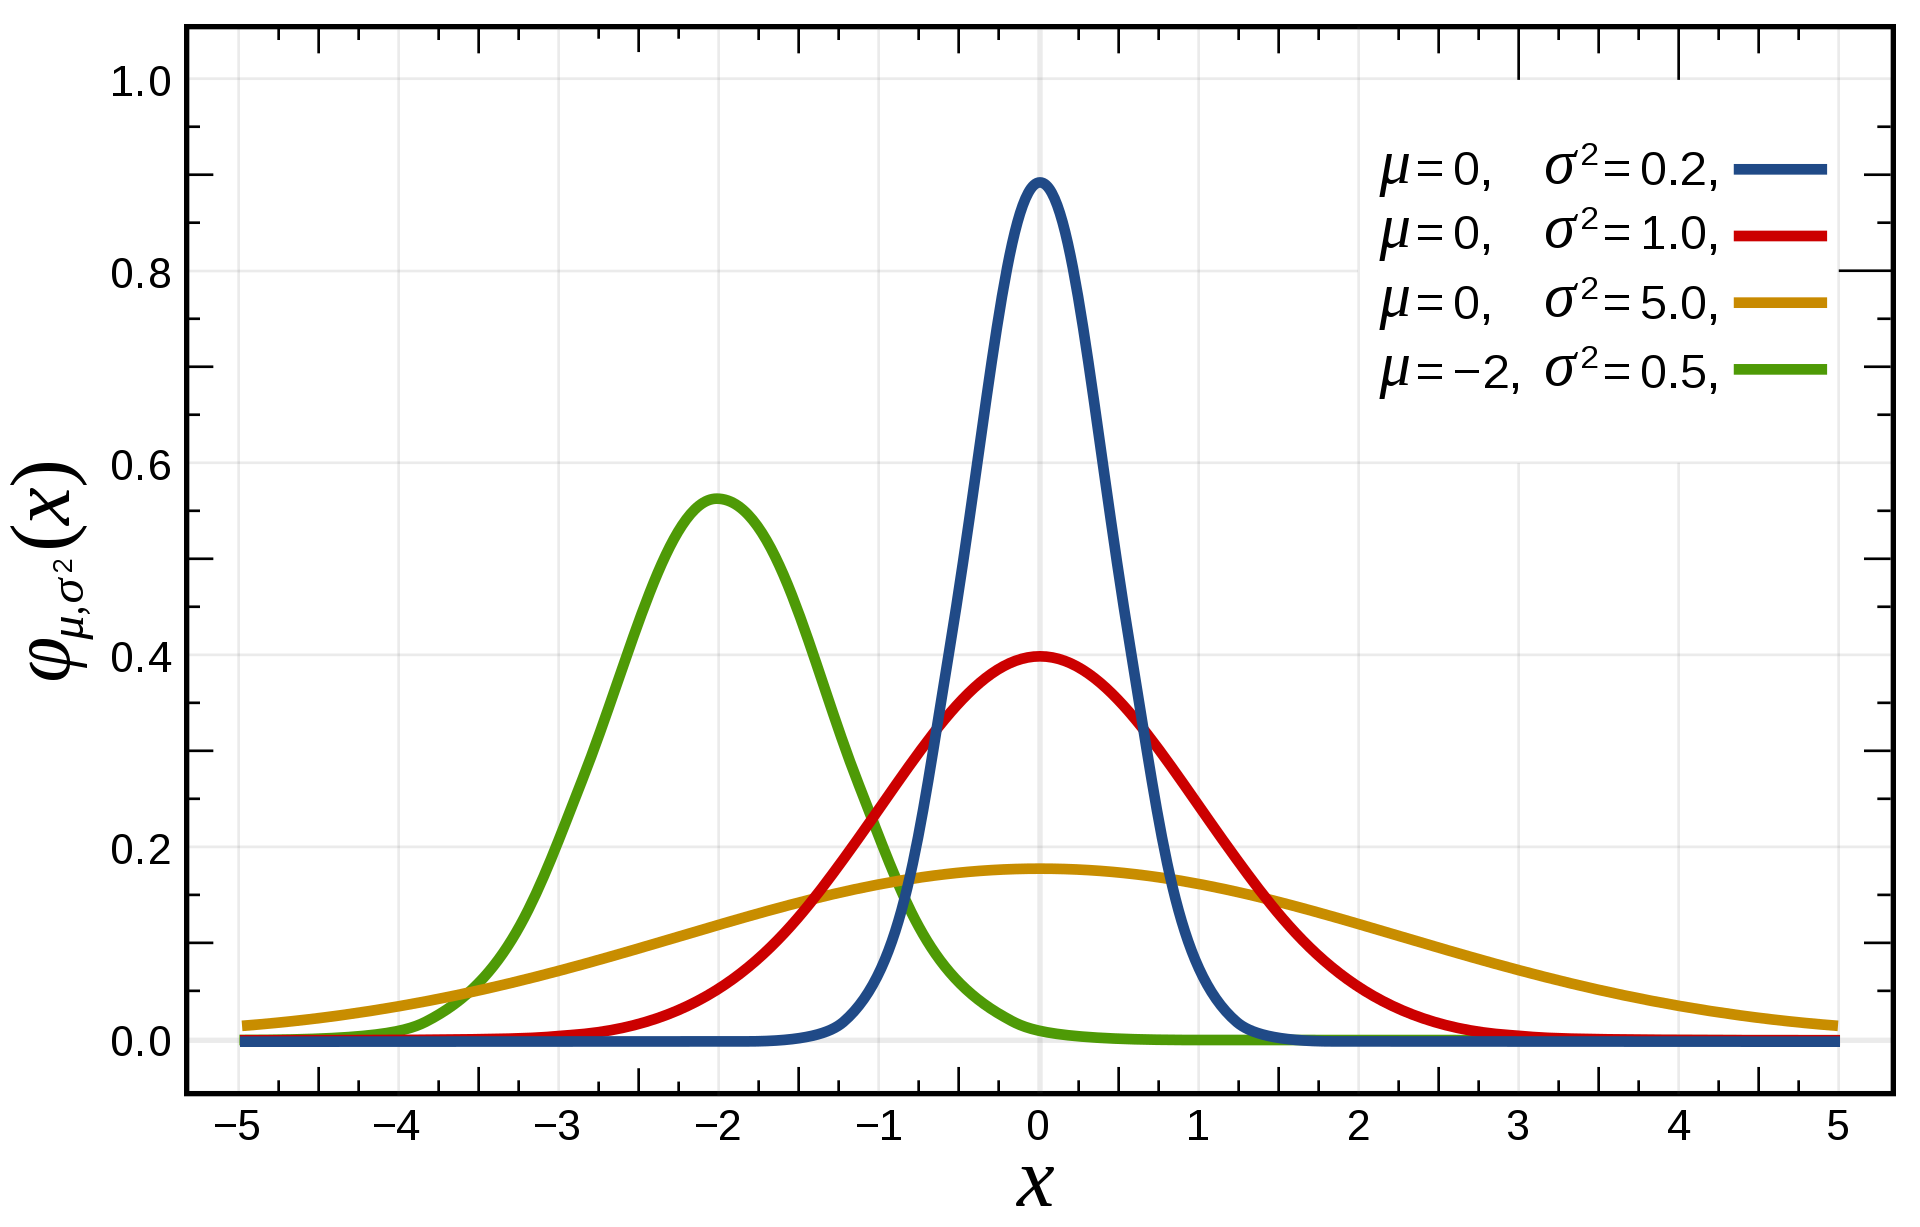
- 첨도 : 확률분포의 뾰족한 정도, 꼬리의 두꺼운 정도를 나타내는 척도
첨도가 3이면 표준정규분포, > 3 이면 표준정규분포보다 정점이 높고 뾰족한 모양, < 3 이면 정점이 낮고 무딘모양
첨도의 값에서 3을 뺀 값으로 첨도를 구하는 경우도 많음 - 0이 기준이 되도록
스케일링
- standard : 평균 0, 편차 1
- min-max : 최솟값 0, 최댓값 1
상관분석
두 변수간 어느 정도 밀접한 관련성을 가지고 변화하는지 알아보는 것
두 변수가 선형관계를 갖는지 -> 어느 방향인지 -> 관계는 얼마나 큰지 분석
두 변수간의 상관 정도로 인과 관계로 해석 금지!
라이브러리 & 메소드
DataFrame
- isnull/isna
- astype
- select_dtypes
- std
- agg
- unique : Series 타입만 가능
- nunique
- value_counts
- groupby
- unstack : MultiIndex 중 특정 인덱스를 컬럼으로 함. default : 마지막 / stack
- sort_values(by, ascending)
- read_csv(path, index, encoding)
- to_csv(path, index, encoding)
- columns
- dropna
- reset_index(drop=True) * drop : 기존 인덱스 제거
- str.contains * ~ : 조건 반대
- drop_duplicates
Pandas
- pivot_table(df, index, values, aggfunc=mean) : groupby를 사용하기 쉽게(추상화) 만든 기능 * 엑셀
pivot과의 차이
“연산이 가능하냐”
pivot_table은 인덱스/컬럼 쌍에 대한 중복 값을 처리할 수 있는 피벗의 일반화
인덱스와 피벗 테이블의 열을 여러 개 사용할 수 있도록 지원
- crosstab(index, columns) : pivot_table을 사용하기 쉽게 만든 기능
- read_html
- concat
Numpy
- ones_like(x) : x와 크기가 같은 1로 이루어진 array를 생성
- triu : 상삼각행렬 / tril : 하삼각행렬
 출처
출처
- Seabornhttps://seaborn.pydata.org/tutorial/function_overview
- 비대칭도
https://ko.wikipedia.org/wiki/%EB%B9%84%EB%8C%80%EC%B9%AD%EB%8F%84
- 첨도
https://ko.wikipedia.org/wiki/%EC%B2%A8%EB%8F%84
- 상관분석
사경환 사회조사분석사
![]() 포스팅 공지
포스팅 공지
작성한 포스팅은 멋쟁이 사자처럼 AI SCHOOl의 수업 내용입니다.
댓글남기기